
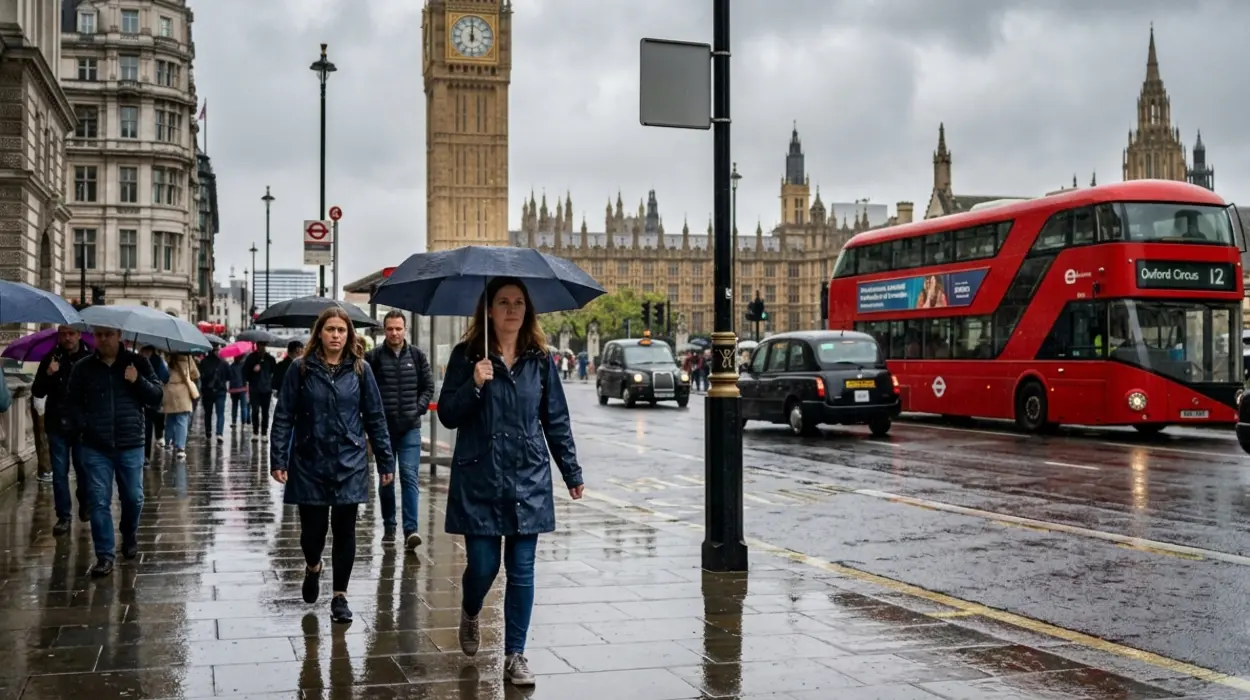
London operates under a temperate oceanic climate designated as Cfb according to the Köppen climate classification system, featuring moderate thermal bands, year-round precipitation distribution, and substantial maritime air mass influences originating from the Atlantic Ocean.
- How Do Historical Weather Patterns Shape Modern London Climate Data?
- What Are the Seasonal Temperature Variations Throughout the Calendar Year?
- What Role Does Precipitation Play in the Local Atmospheric Environment?
- How Do Wind Patterns and Atmospheric Pressure Influence Daily Forecasts?
- What Are the Implications of Climate Change on Future London Weather Trends?
The meteorological profile of London, United Kingdom, is governed by its geographical latitude of 51.5074 degrees North and longitude of 0.1278 degrees West, alongside its elevation of 11 meters above mean sea level. Atmospheric conditions fluctuate frequently due to the passage of frontal systems and depressions moving eastward across the North Atlantic. The primary driving mechanism behind daily weather patterns is the North Atlantic Drift, a warm ocean current that moderates local temperatures, preventing the severe cold extremes experienced at comparable latitudes in continental landmasses.
Mean annual precipitation totals approximately 627.5 millimeters, spread across roughly 110 days with measurable rainfall exceeding 1.0 millimeter. Atmospheric pressure configurations dictate short-term shifts between clear skies and overcast conditions. High-pressure systems, or anticyclones, bring stable, clear, and calm weather, whereas low-pressure systems, or depressions, introduce wind, cloud cover, and precipitation. Relative humidity remains consistently high throughout the year, averaging around 70 percent to 80 percent, driven by moisture evaporation from the River Thames and regional vegetation transpiration.
How Do Historical Weather Patterns Shape Modern London Climate Data?
Historical meteorological records maintained by the Met Office since the establishment of continuous observation stations in 1841 demonstrate a clear long-term warming trend, rising mean temperatures, and an increased frequency of localized atmospheric heat extremes across Greater London.
Systematic weather data collection in London possesses a long institutional history, starting with precipitation tracking at Kew Gardens in January 1697 and continuous temperature series initiated at the Greenwich Observatory in 1841. Additional reference observation points include Heathrow Airport established in 1948, St James’s Park established in 1910, Hampstead established in 1910, and Northolt established in 1948. Analysis of these long-term datasets reveals that mean daily maximum temperatures in the urban center now routinely exceed historical mid-twentieth-century baselines by 1.0 degree Celsius to 1.5 degrees Celsius.
The urban heat island effect significantly amplifies recorded temperatures within the central districts compared to surrounding rural counties such as Surrey and Kent. Dense concentrations of asphalt, concrete, and commercial infrastructure absorb solar radiation during daylight hours and reradiate thermal energy slowly throughout the night. Consequently, nighttime minimum temperatures in central London stations like St James’s Park often register 2.0 degrees Celsius to 4.0 degrees Celsius warmer than outlying suburban recording instruments. Historical extremes punctuate this baseline data, highlighted by the historic temperature threshold of 40.2 degrees Celsius recorded at both Heathrow Airport and St James’s Park on July 19, 2022, eclipsing the previous national benchmark.
What Are the Seasonal Temperature Variations Throughout the Calendar Year?
Seasonal thermal progression in London exhibits distinct transitions, characterized by cool winters with average daily highs of 8.5 degrees Celsius and warm summers featuring average daily highs of 23.6 degrees Celsius.
Winter spans from December through February, during which prevailing winds blow predominantly from the southwest and west across the Atlantic Ocean. Mean daily minimum temperatures during these winter months hover between 2.0 degrees Celsius and 5.0 degrees Celsius, resulting in occasional air frosts that occur on an average of 16 days per year. Snowfall remains an infrequent occurrence, with cumulative snow accumulation rarely persisting for more than a few days due to maritime thermal moderation.
Spring marks a gradual transition from March to May, as solar elevation increases and day length extends. Mean daily maximum temperatures rise from 11.7 degrees Celsius in March to 18.5 degrees Celsius in May. Summer spans from June to August, bringing peak solar radiation and stable atmospheric conditions under persistent anticyclonic ridging. July represents the warmest month, boasting mean daily maximums of 23.6 degrees Celsius and mean daily minimums of 15.5 degrees Celsius. Autumn runs from September to November, initiating a rapid decline in temperatures and an increase in cloud cover, surface wind speeds, and frontal precipitation events.
What Role Does Precipitation Play in the Local Atmospheric Environment?
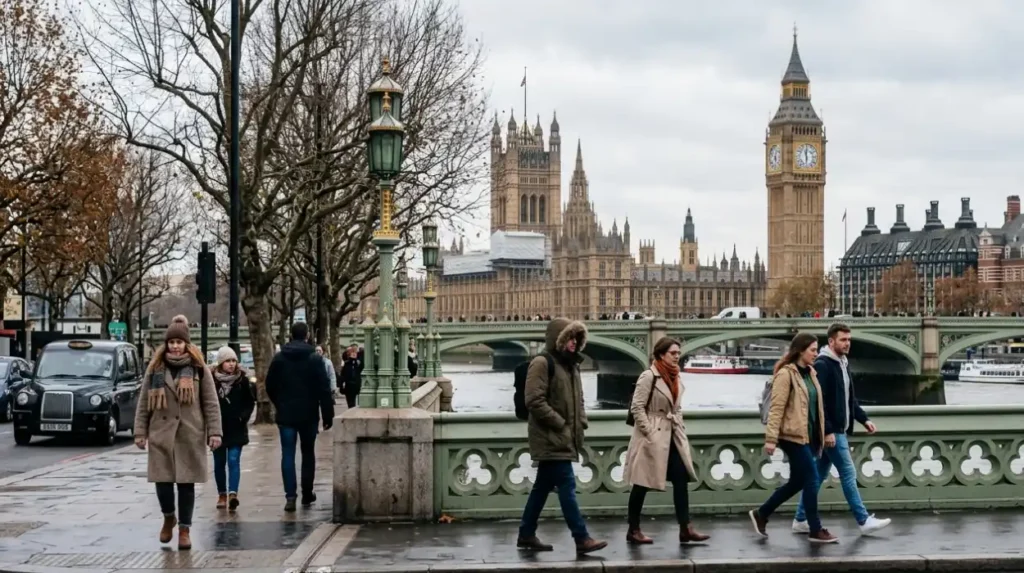
Precipitation in London is non-seasonal and evenly distributed across all twelve months, averaging between 40 millimeters and 65 millimeters monthly, driven by polar maritime and tropical maritime air mass collisions.
Rainfall events are typically characterized by light to moderate intensity showers rather than tropical downpours, owing to the mechanical lifting of moist air parcels over topography and urban roughness elements. October and November frequently record the highest monthly precipitation totals, averaging approximately 67.9 millimeters and 66.0 millimeters respectively at primary monitoring sites. Conversely, drier periods often occur in the late winter and early spring months, such as March, which records an average precipitation low of 39.0 millimeters.
Convective thunderstorms occur on an average of 16 days per year, predominantly during the summer months when ground heating generates localized atmospheric instability. These storms produce intense localized rainfall, lightning, and occasionally small hail, though widespread severe weather disruption remains statistically rare. Prolonged droughts are defined nationally by consecutive weeks of below-average rainfall, which can trigger regional water conservation protocols enforced by utility providers such as Thames Water across the Greater London authority area.
How Do Wind Patterns and Atmospheric Pressure Influence Daily Forecasts?
Wind direction and velocity across London are primarily dictated by the North Atlantic Oscillation, generating prevailing westerly and southwesterly winds with mean annual speeds ranging from 8 knots to 12 knots.
Topographical features of the London basin, including the North Downs to the south and the Chiltern Hills to the northwest, exert localized friction on approaching air masses, modifying wind shear and turbulence at ground level. High-pressure cells situated over continental Europe or the Azores bring stable, clear conditions with light, variable breezes. When Siberian high-pressure systems expand westward during winter, London experiences cold, biting easterly winds that drive wind-chill temperatures well below freezing despite nominal air thermometer readings.
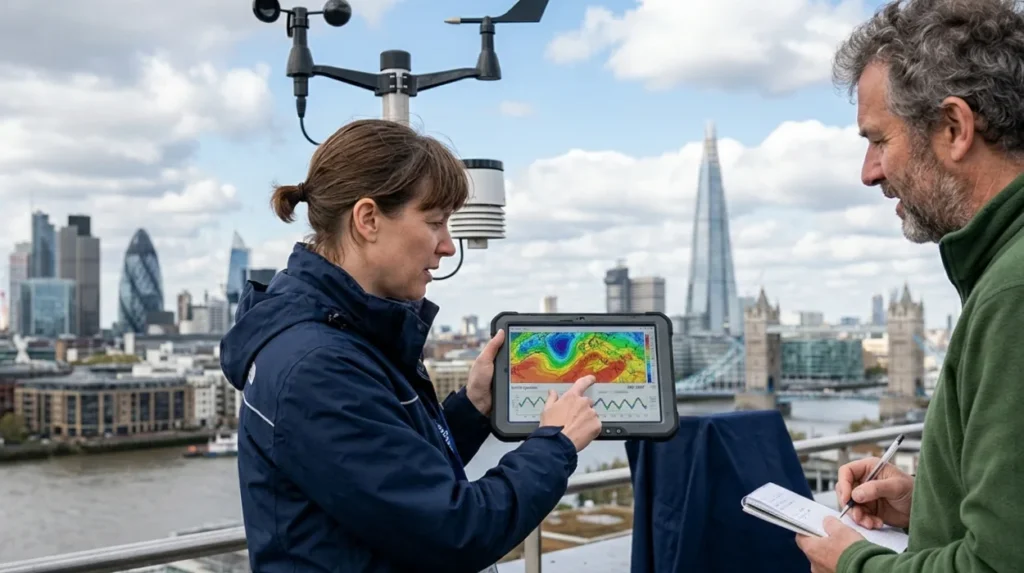
Severe windstorms are associated with deep Atlantic depressions passing to the north of the United Kingdom, sending intense cold fronts across southern England. Gusts exceeding 50 knots occasionally cause localized structural damage, transport delays across the National Rail network, and temporary flight restrictions at London Heathrow Airport, London Gatwick Airport, and London City Airport. Meteorological forecasting models process millions of variables daily to predict these pressure shifts, utilizing data from the Met Office operational supercomputing infrastructure to provide accurate short-range and medium-range weather intelligence.
What Are the Implications of Climate Change on Future London Weather Trends?
Climate change projections issued by the Met Office and the Intergovernmental Panel on Climate Change indicate that London will experience intensified urban warming, drier summers, and an increased frequency of extreme weather events over the coming decades.
Mathematical climate simulations project that mean summer temperatures in London could rise by up to 4.0 degrees Celsius by the year 2070 under high-emissions scenarios. This thermal increase will amplify the urban heat island intensity, posing public health risks to vulnerable demographic cohorts, including the elderly and individuals with pre-existing respiratory conditions. Infrastructure systems across the capital—such as the London Underground transit network, historic building stock, and urban drainage networks—face mounting adaptation pressures to manage higher peak heatloads and intense flash flooding resulting from heavier downpours.
Sea level rise along the tidal River Thames represents another critical long-term implication driven by thermal expansion of oceanic waters and polar ice sheet melting. Protection mechanisms such as the Thames Barrier, operational since 1982, undergo continuous structural assessments and operational modifications to defend central London from catastrophic tidal surge flooding. Comprehensive environmental monitoring by agencies like the Environment Agency ensures that real-time data feeds directly into emergency response frameworks, maintaining urban resilience against shifting meteorological realities.
What type of climate does London have?
London has a temperate maritime climate, commonly classified as Cfb under the Köppen climate classification. It generally experiences mild winters, warm summers and rainfall throughout the year.