

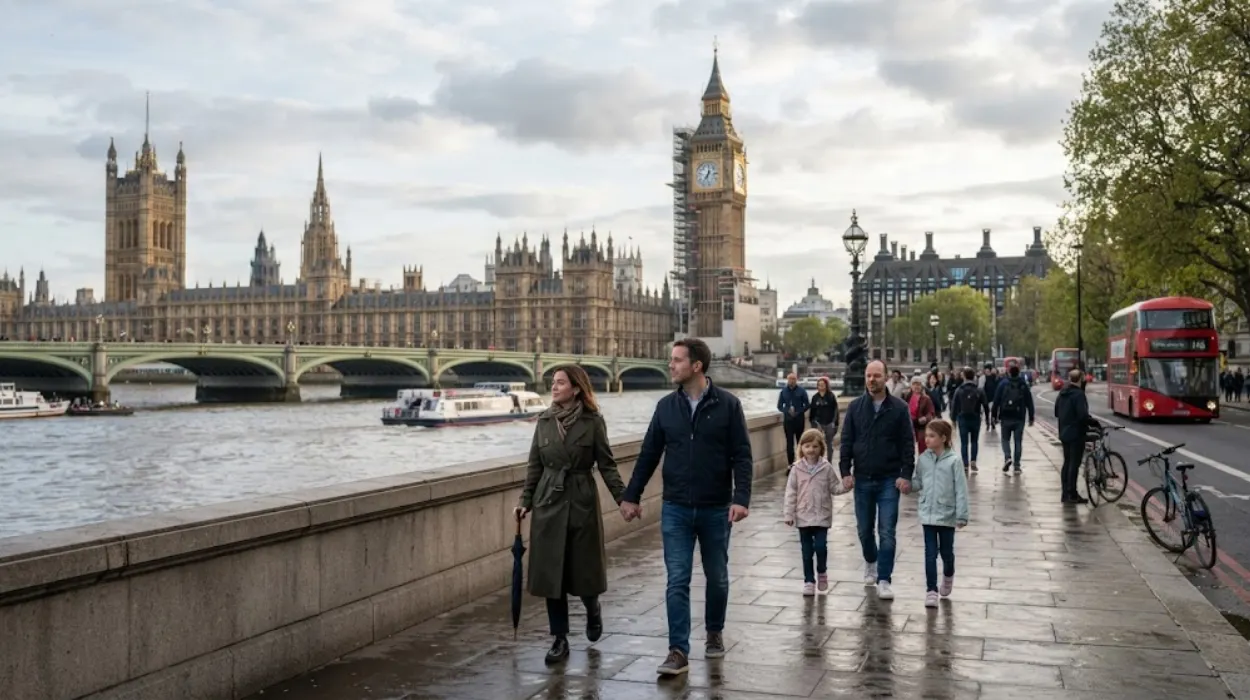
London experiences a temperate oceanic climate (Köppen classification Cfb) with an average annual temperature of 11.1°C (52.0°F), featuring mild winters with January averages of 5.2°C (41.4°F) and warm summers with July averages of 19.0°C (66.2°F).
- How does the Urban Heat Island effect impact London temperatures?
- What causes extreme temperature events and heatwaves in London?
- What historical climate trends define London’s temperature records?
- How do oceanic currents and atmospheric patterns regulate London weather?
- What is the economic and infrastructural impact of temperature shifts in London?
- How is London adapting to future climate and temperature projections?
- What are the essential thermal data points for London?
The United Kingdom Meteorological Office (Met Office) records baseline climate observations for Greater London across key meteorological stations including Kew Gardens, Heathrow Airport, and Hampstead Frost Hollow. The region operates under a maritime thermal profile dictated by the North Atlantic Current, which prevents extreme seasonal temperature swings common in continental European cities located at similar northern latitudes, such as Warsaw or Kyiv.
During the meteorological winter (December through February), daily maximum temperatures in Central London average 8.1°C (46.6°F) while daily minimum temperatures average 2.7°C (36.9°F). Freezing temperatures occur on an average of 12 to 15 nights per winter season, primarily driven by radiative cooling under clear, anticyclonic weather conditions.
Spring (March through May) serves as a transition period characterized by rapid increases in diurnal temperature variation. Average daily high temperatures shift from 10.3°C (50.5°F) in March to 17.9°C (64.2°F) in May. Solar irradiance increases significantly during this period, raising ground temperatures across the Thames Basin.
Summer (June through August) delivers the highest mean thermal readings. Daily high temperatures average 21.2°C (70.2°F) in June, 23.5°C (74.3°F) in July, and 23.2°C (73.8°F) in August. Nighttime lows remain mild, averaging 13.8°C (56.8°F) across the mid-summer peak.
Autumn (September through November) demonstrates steady thermal decay. September retains warm air masses with average highs of 19.3°C (66.7°F), but temperatures decline to an average high of 10.9°C (51.6°F) by late November as Atlantic low-pressure systems dominate regional weather patterns.
How does the Urban Heat Island effect impact London temperatures?
The Urban Heat Island (UHI) effect raises ambient air temperatures in Central London by up to 10°C (18°F) above surrounding rural areas like Kent and Surrey due to dense building materials, concentrated human activity, and reduced green canopy cover.
The London Urban Heat Island is a localized thermal anomaly caused by urban geometry, land surface alterations, and anthropogenic heat dissipation. Dense concrete, asphalt, and brick structures absorb high levels of shortwave solar radiation throughout daytime hours. At night, these thermal masses slowly re-radiate longwave thermal energy back into the atmospheric boundary layer, preventing rapid nocturnal cooling.
The intensity of London’s UHI varies spatial-temporally, peaking during clear, calm summer nights when radiative cooling in rural outskirts is unimpeded. Central zones—such as the City of London, Westminster, and Camden—maintain microclimates significantly warmer than outer suburban boroughs like Bromley, Havering, or Hillingdon.
Microclimate Variations across Greater London
Urban density gradients create distinct thermal zones within the metropolis. High-density commercial districts feature elevated surface temperatures due to extensive vertical surfaces that trap radiation through multi-reflection processes.
Parks and open blue-green spaces interrupt this heat profile. Green infrastructure locations—such as Hyde Park, Richmond Park, and Regent’s Park—generate localized cooling zones known as urban cool islands (UCIs). Air temperatures within Richmond Park can register 2°C to 4°C lower than adjacent built environment spaces during heat events.
The River Thames acts as a thermal buffer. The river moderates daytime thermal spikes in adjacent areas such as the South Bank and Greenwich while retaining heat during winter months, stabilizing coastal-style microclimates along its central path.
Anthropogenic Heat Sources and Infrastructure Drivers
Anthropogenic emissions directly contribute to the London UHI. Heating systems, air conditioning condensers, industrial operations, and transportation networks release sensible heat directly into the lower troposphere.
Transport networks create subterranean and surface heat reservoirs. The London Underground network absorbs and radiates heat into surrounding clay soil strata, causing deep line platforms on the Central, Northern, and Victoria lines to sustain elevated ambient air temperatures year-round. Transport vehicle exhaust along primary arteries, such as the A40 and M25 motorways, further elevates localized surface friction and ambient temperatures.
What causes extreme temperature events and heatwaves in London?
Extreme high temperatures in London occur when high-pressure atmospheric blocking patterns over Northern Europe pull tropical continental air masses from North Africa and Southern Europe northward across the English Channel.
Extreme temperature events in the Thames Basin are governed by synoptic-scale atmospheric dynamics. Under standard conditions, the prevailing westerly jet stream brings cool, moist polar maritime air off the Atlantic Ocean. When the jet stream buckles and forms an omega block or cut-off high-pressure system over Scandinavia or Central Europe, normal weather progression halts.
This atmospheric configuration creates a synoptic continental heat plume. Southerly air flows import dry, superheated air masses originating over the Sahara Desert and Iberian Peninsula across mainland France into South East England.
The 40°C Threshold and Historical Heatwave Milestones
On July 19, 2022, London officially surpassed the 40°C threshold for the first time in recorded meteorological history. The Met Office station at London Heathrow recorded an absolute maximum temperature of 40.2°C (104.4°F), while St James’s Park registered 40.2°C.
This event shattered the prior record of 38.7°C (101.7°F) set at Cambridge Botanic Garden in July 2019, and the older record of 38.1°C recorded at Kew Gardens during the August 2003 European heatwave. Subsequent heat events in recent summers, including August 2026 spikes reaching 38.1°C at Kew Gardens, confirm an increased frequency of extreme heat occurrences in South East England.
Historical Records of Extreme Cold
Historical cold extremes in London stem from easterly synoptic air flows known as the “Beast from the East.” These conditions occur when sudden stratospheric warming events split the polar vortex, driving cold Siberian air masses across the North Sea.
The lowest temperature ever recorded in Greater London occurred on December 20, 2010, when the weather station at Northolt dropped to -16.1°C (3.0°F). Central London stations maintained slightly higher minimums due to the UHI effect, with Kew Gardens recording -10.0°C (14.0°F) during the same cold wave. Historic accounts record the winter of 1963, where the River Thames froze over in outer reaches, driven by continuous sub-zero temperatures from January through February.
What historical climate trends define London’s temperature records?
London holds one of the longest continuous instrumental meteorological records in the world, documenting a clear warming trend from the Little Ice Age of the 17th century to modern anthropogenic climate shifts.

Instrumental weather monitoring in London began in the late 17th century. The Central England Temperature (CET) dataset, compiled since 1659, provides a continuous record of regional climate variations affecting the London Basin.
During the 17th and 18th centuries, London experienced the tail end of the Little Ice Age. Winter conditions were severe enough to freeze the surface of the River Thames, enabling “Frost Fairs” between London Bridge and Blackfriars. The last Frost Fair took place in February 1814, lasting four days after ice blocked the arches of Old London Bridge, slowing river flow.
The Volcanic Disruptions of the 19th Century
London’s thermal history includes abrupt cold anomalies triggered by volcanic forcing. The eruption of Mount Tambora in Indonesia in April 1815 injected immense volumes of sulfur dioxide aerosols into the stratosphere.
This event caused the “Year Without a Summer” in 1816. London recorded unseasonal summer frosts and prolonged cloud cover, suppressing seasonal daily highs below 15°C throughout July and August. Crop failures across the Thames Valley resulted from this forced climate cooling.
Long-Term Climate Normal Shift Data
Analysis of 30-year climate normal datasets managed by the World Meteorological Organization (WMO) highlights clear long-term thermal increases across Greater London. Comparing the 1961–1990 baseline to the 1991–2020 baseline demonstrates warming across all twelve calendar months.
Mean annual temperatures in London warmed by approximately 1.0°C between these two reference periods. The frequency of air frost days declined by over 20%, while summer heatwave days (defined as daily maximums exceeding 28°C) tripled across suburban monitoring sites.
How do oceanic currents and atmospheric patterns regulate London weather?
London’s climate is thermally regulated by the Gulf Stream and North Atlantic Drift currents, which transport warm equatorial water across the Atlantic Ocean, keeping UK temperatures 10°C to 15°C warmer than equivalent global latitudes.
London sits at latitude 51.5074° N, positioning it parallel to Calgary, Canada, and Voronezh, Russia. Without maritime thermal transport, London would experience continental subarctic weather conditions characterized by prolonged frozen soils and heavy winter snowfall.
The Gulf Stream carries warm, high-salinity water from the Gulf of Mexico northeastward across the Atlantic Basin, becoming the North Atlantic Current. This current heats the prevailing westerly air masses moving across the UK, maintaining air temperatures well above freezing throughout winter months.
The Role of the North Atlantic Oscillation (NAO)
The North Atlantic Oscillation (NAO) acts as the primary atmospheric engine governing seasonal temperature fluctuations in London. The NAO measures the pressure gradient between the Icelandic Low and the Azores High systems.
During a Positive NAO phase (+NAO), a strong pressure gradient forces powerful westerly winds across the Atlantic. This brings mild, wet, and stormy winter weather to London, pushing temperatures up to 13°C in January.
During a Negative NAO phase (-NAO), the atmospheric pressure gradient weakens, allowing the jet stream to meander. This enables cold, dry polar or continental air masses from North Africa, Canada, or Scandinavia to enter South East England, causing extended winter cold snaps and summer heat domes.
Air Masses Affecting the Thames Basin
London is located at the intersection of five major air masses, each dictating distinct thermal and moisture conditions:
- Polar Maritime (Pm): Originates over the Northern Atlantic; brings cool, showery weather with moderate temperatures in both summer and winter.
- Tropical Maritime (Tm): Originates over the Azores; delivers mild, humid winter conditions and warm, misty summer weather.
- Continental Polar (Pc): Originates over Scandinavia and Russia; brings dry, sub-zero winter temperatures and cold winds.
- Continental Tropical (Ct): Originates over North Africa and Southern Europe; causes dry, severe summer heatwaves.
- Arctic Maritime (Am): Originates over the Arctic Ice Cap; brings short-lived winter snow showers and sudden temperature drops.
What is the economic and infrastructural impact of temperature shifts in London?
Temperature shifts directly affect London’s energy consumption networks, public health outcomes, public transport systems, and urban civil engineering standards.
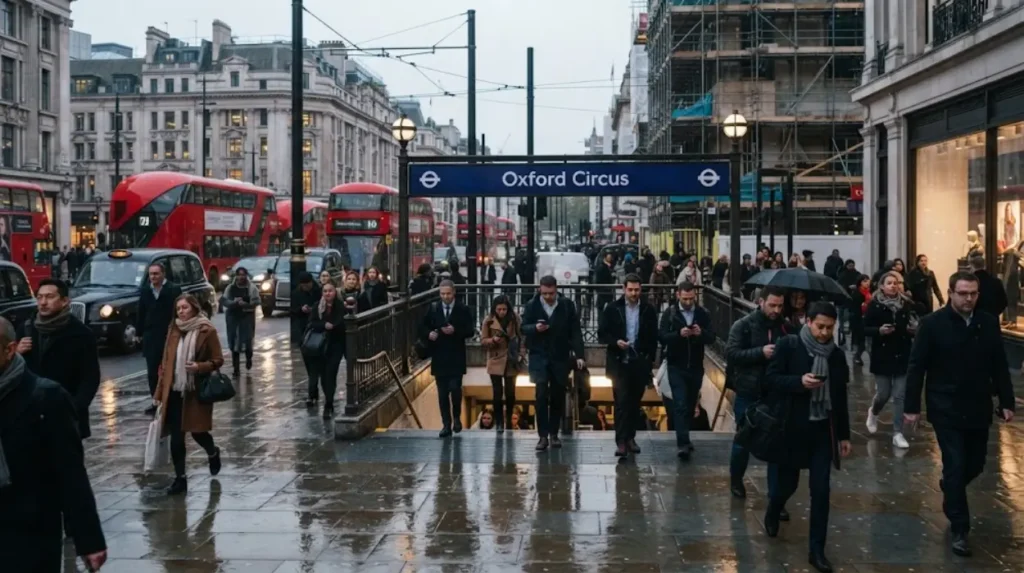
Thermal variations alter operational conditions across Greater London. Increasing summer heat risks infrastructure integrity while winter thermal demands shift regional energy consumption patterns.
Public Health and Mortality Impacts
Temperature spikes introduce major public health risks. Heat-related illness and mortality increase when daily temperatures exceed 24.5°C, a threshold defined as the health-critical trigger for South East England by the UK Health Security Agency (UKHSA).
The 2022 heatwave events caused over 3,000 excess deaths across England, with Greater London recording high per-capita mortality rates due to urban heat retention. vulnerable demographics face elevated risks of hyperthermia, cardiovascular strain, and severe respiratory stress caused by secondary ground-level ozone formation.
Transport and Civil Infrastructure Vulnerabilities
London’s transport networks encounter physical limits during high-temperature conditions. Rail infrastructure operated by Network Rail and Transport for London (TfL) faces thermal expansion challenges.
When air temperatures exceed 30°C, rail track temperatures can reach 50°C, leading to rail buckling. TfL imposes speed restrictions across surface lines—including the Elizabeth Line, Overground, and national rail corridors—to prevent derailments.
The London Underground network faces structural cooling constraints. Underground lines engineered in the 19th and early 20th centuries lack built-in environmental control systems. Elevated ambient soil temperatures surrounding deep-level tunnels limit heat extraction, driving summer carriage temperatures above 35°C on non-air-conditioned lines.
Energy Grid Demand Shifts
Historically, London’s energy demands peaked during winter for space heating using natural gas and electricity networks. Modern temperature trends are shifting peak demand periods toward summer months.
Increased reliance on commercial and residential air conditioning drives summer electrical grid strain. The National Grid ESO monitors summer cooling loads to prevent localized transformer overloads in high-density central hubs like Canary Wharf and the City of London.
How is London adapting to future climate and temperature projections?
London is deploying climate adaptation plans that combine urban greening, building code updates, sustainable drainage systems, and passive cooling retrofits to maintain livability through projected future warming.
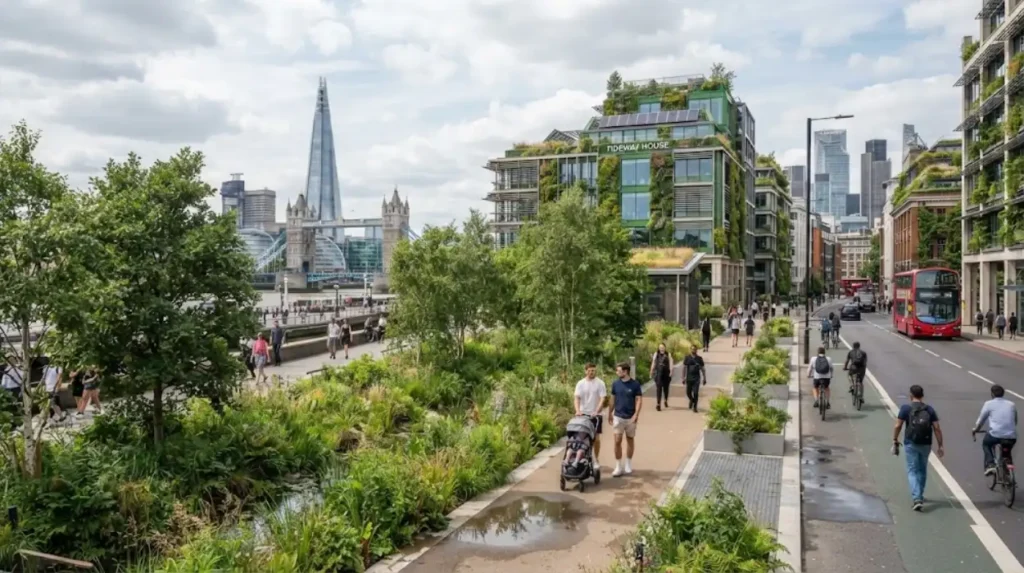
Projections from the Met Office UK Climate Projections (UKCP18) framework indicate that London’s climate will experience hotter, drier summers and warmer, wetter winters by 2050. Summer daily high temperatures are projected to increase by 2.5°C to 4.5°C under medium-to-high emission scenarios.
The Mayor of London’s Climate Adaptation Strategy outlines spatial policies to mitigate rising urban heat risks. The strategy mandates integration of nature-based solutions into new property developments and civic infrastructure projects.
Spatial Urban Greening Initiatives
The Greater London Authority (GLA) enforces the Urban Greening Factor (UGF) for new planning submissions. The UGF assesses land area based on its capacity to provide ecosystem services, including evapotranspiration cooling.
Developments must incorporate green roofs, vertical living walls, permeable pavements, and urban canopy trees. The Mayor’s goal to increase London’s tree canopy by 10% by 2050 targets the strategic planting of broadleaf species—such as London Plane (Platanus × acerifolia) and English Oak (Quercus robur)—along major urban heat corridors to provide shading and reduce ground surface temperatures.
Architecture and Civil Engineering Adaptations
Building regulations in the UK (specifically Part O) limit overheating risks in residential structures. Architects working across London must design structures that prioritize passive cooling methods over active mechanical systems.
Design standards require solar shading retrofits, thermal mass optimization, natural cross-ventilation corridors, and high-albedo reflective surface coatings. These measures prevent interior thermal buildup during heat events, protecting residents without over-taxing the regional electrical grid.
What are the essential thermal data points for London?
Key meteorological benchmarks establish the historical and operational thermal boundaries of Greater London’s climate profile.
The following factual metrics summarize London’s historical and contemporary thermal environment:
- Absolute Highest Temperature: 40.2°C (104.4°F) recorded at Heathrow Airport on July 19, 2022.
- Absolute Lowest Temperature: -16.1°C (3.0°F) recorded at Northolt on December 20, 2010.
- Warmest Month on Record: July 2006, with a mean monthly temperature of 20.9°C (69.6°F).
- Coldest Winter on Record: Winter of 1962–1963, featuring 67 consecutive days of air frost in outer suburban monitoring stations.
- Average Annual Sunshine Duration: 1,633 hours recorded at Kew Gardens.
- Average Annual Rainfall: 601 millimeters (23.7 inches), distributed uniformly across 109 rain days per calendar year.
- Primary Monitoring Baseline Stations: Kew Gardens, London Heathrow, Hampstead, St James’s Park, and Northolt.
Understanding these foundational parameters enables policymakers, urban planners, transport operators, and residents to prepare for the ongoing evolution of London’s thermal climate landscape.
What is London’s average climate classification and year-round temperature?
London experiences a temperate oceanic climate (Köppen classification Cfb). Its average annual temperature is 11.1°C (52.0°F), characterized by mild winters averaging 5.2°C (41.4°F) in January and warm summers averaging 19.0°C (66.2°F) in July.