
The Londoner News provides a comprehensive analysis of the infrastructure, meteorological models, and computational frameworks that drive the public-facing weather communication network in the capital of the United Kingdom.
- How Does BBC Weather London Source Its Real-Time Meteorological Data?
- What Computational Forecasting Models Generate the Automated Predictions for London?
- How Do Urban Heat Islands Modify the Temperature Readings Recorded Across Greater London?
- What Statistical Criteria Metrics Define the Predictive Accuracy of London Forecasts?
- How Has the Historical Development of the BBC Weather Service Changed Communication Systems?
- What Climatic Patterns Shape the Long-Term Seasonal Baseline Data for London?
- How Does Climate Change Shift the Frequency of Extreme Events in the Capital?
- How Do Consumer Platforms Automatically Personalize and Present the London Forecast?
How Does BBC Weather London Source Its Real-Time Meteorological Data?
BBC Weather sources its core meteorological data from MeteoGroup, an international commercial weather provider that utilizes data feeds from the European Centre for Medium-Range Weather Forecasts and the UK Met Office. This integration powers the digital architecture across public applications.
The collection network operates through three distinct layers of observational infrastructure: ground-based sensor arrays, upper-air measurement frameworks, and spaceborne remote sensing networks. Ground infrastructure relies heavily on automated weather stations located at critical entry nodes, such as the Heathrow Airport station, which has compiled continuous baseline data since 1948, and the St. James’s Park station in central London (Wade, 2017). These ground stations record physical metrics including surface air temperature, atmospheric pressure, relative humidity, precipitation accumulation, and wind velocity at one-minute frequencies.
Upper-air configurations utilize radiosondes—instrument packages lofted by atmospheric balloons—launched regularly from regional hubs to measure pressure, temperature, and humidity profiles up to altitudes of 30 kilometers. Spaceborne observation relies on geostationary and polar-orbiting satellites managed by the European Organisation for the Exploitation of Meteorological Satellites. These satellites capture high-resolution infrared and water vapor radiances, which track convective systems and cloud-top temperatures across the Greater London area.
What Computational Forecasting Models Generate the Automated Predictions for London?
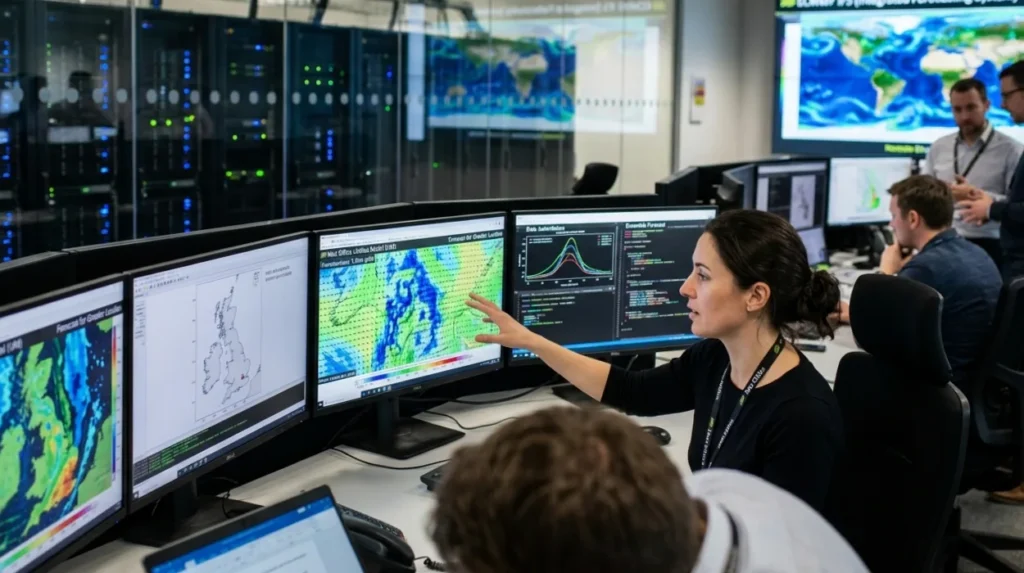
Numerical weather prediction models process raw observational metrics through thermodynamic and hydrodynamic equations on high-performance computing clusters to project the future state of the atmosphere over the British Isles. These calculations eliminate human subjectivity from raw projections.
The automated system synthesizes outputs from multiple global and regional atmospheric models to construct the specific operational forecast for London. The foundational systems include:
- The Integrated Forecasting System: Managed by the European Centre for Medium-Range Weather Forecasts, this system executes global deterministic and ensemble forecasts, calculating spatial variables across a nine-kilometer grid resolution (Riishojgaard, 2021).
- The Unified Model: Operated by the UK Met Office, this configuration processes localized regional data down to a 1.5-kilometer grid scale, explicitly resolving convective cloud boundary layers over urban zones.
- The Global Forecast System: Administered by the National Oceanic and Atmospheric Administration, this global framework provides comparative initialization data for medium-range projections.
The processing mechanism consists of data assimilation, execution, and post-processing. During data assimilation, current observations adjust a prior short-range forecast to generate an accurate initial state. The system resolves three-dimensional grids covering the atmosphere, computing physics parameters such as radiative transfer, boundary layer turbulence, and moisture phase changes.
The raw grid outputs undergo statistical post-processing via machine learning frameworks and model output statistics to correct systematic biases caused by local topography and land cover before delivery to the digital interface.
How Do Urban Heat Islands Modify the Temperature Readings Recorded Across Greater London?
The urban heat island effect describes the localized warming of an urban area relative to its rural surroundings due to the thermal mass of built infrastructure, anthropogenic heat emissions, and reduced evaporative cooling. This microclimatic variance causes sharp divergence within public tracking applications.
The physical mechanism operates through heat retention and slow release. Concrete, brick, and asphalt structures possess high volumetric heat capacities and thermal conductivities, absorbing shortwave solar radiation throughout the diurnal cycle. At night, these surfaces radiate longwave thermal energy back into the lowest layers of the atmosphere, preventing the rapid cooling seen in rural environments. Anthropogenic sources, which include building HVAC cooling systems, combustion engines, and industrial machinery, inject additional sensible heat directly into the urban canopy layer.
The operational impact manifests as significant internal temperature differentials across the capital. Under stable, cloudless anticyclonic weather conditions, the urban core within central London can register nocturnal minimum temperatures up to 10 degrees Celsius higher than rural monitoring sites outside the M25 motorway.
A prime example occurs when comparing the St. James’s Park station in Westminster with the Heathrow station or rural points in Kent; the dense core consistently displays elevated baselines, affecting localized frost, energy demand, and public health metrics during summer heatwaves (Turton, 2025).
What Statistical Criteria Metrics Define the Predictive Accuracy of London Forecasts?
Predictive accuracy evaluations quantify the variance between numerical model outputs and subsequent in-situ measurements, using standard statistical parameters recognized by the World Meteorological Organization. These verification metrics isolate specific operational performance vectors.
The primary mathematical formulations utilized to evaluate temperature, precipitation, and pressure forecasts include:
Mean Absolute Error
Mean absolute error calculates the average magnitude of the errors in a set of predictions, without considering their direction. The calculation follows the formula:
$$MAE = \frac{1}{n}\sum_{i=1}^{n}|y_i – x_i|$$
where $y_i$ represents the predicted value and $x_i$ represents the observed physical value.
Root Mean Square Error
Root mean square error measures the square root of the average of squared differences between prediction and observation, placing a higher penalty on large, isolated deviations. The formula is expressed as:
$$RMSE = \sqrt{\frac{1}{n}\sum_{i=1}^{n}(y_i – x_i)^2}$$
Brier Score
The Brier score evaluates the accuracy of probabilistic forecasts, such as a percentage chance of precipitation, measuring the mean squared difference between the predicted probability and the actual binary outcome. It is computed using:
$$BS = \frac{1}{n}\sum_{i=1}^{n}(f_i – o_i)^2$$
where $f_i$ is the forecast probability and $o_i$ is the actual outcome (0 for no rain, 1 for rain).
The accuracy curve displays predictable decay as the forecasting timeline extends. Twenty-four-hour short-range forecasts maintain a mean absolute error of less than 1.0 degree Celsius for temperature and a critical success index exceeding 85% for precipitation events.
By day five, the mean absolute error increases to approximately 2.0 degrees Celsius, driven by the exponential growth of small initial errors in the chaotic fluid dynamics of the atmosphere. Beyond day ten, the predictive skill drops toward historical climatological averages, rendering specific deterministic hourly data statistically uninformative.
How Has the Historical Development of the BBC Weather Service Changed Communication Systems?
The BBC Weather communication framework transitioned from basic manual transcriptions into highly automated, multi-platform graphic delivery channels over a century of operations. This progression tracks the broader evolution of consumer computing and information design.
The operational timeline of public weather broadcasting highlights major technological milestones:
First Radio Meteorological Broadcast
1922
The British Broadcasting Company transmits the first daily audio synopsis from the UK Met Office via radio telegraphy.
Inaugural Television Weather Forecast
1936
Experimental television broadcasts introduce visual weather charts, which are suspended during the geopolitical conflicts of World War II.
First In-Vision Professional Meteorologist
1954
George Cowling becomes the first professional forecaster to appear on screen, manually drawing isobar lines and wind vector arrows on physical charts using charcoal markers.
Deployment of Computer Graphics
1985
The traditional magnetic weather symbols are replaced by television graphics generated by early digital computers, which standardize symbols for rainfall, cloudiness, and sunlight (Macdonald, 2021).
Introduction of Three-Dimensional Map Projections
2005
Broadcasts implement an angled, virtual 3D rendering of the British Isles, introducing automated camera flyovers that transition away from traditional flat graphic profiles.
Transition to MeteoGroup Commercial Data Systems
2018
The BBC officially switches its operational data provider from the state-owned UK Met Office to MeteoGroup, updating the visual interface across mobile apps, websites, and television outputs.
The system has advanced from hand-delivered fax charts to cloud-native data pipelines. Modern platforms process real-time geospatial vector data to update millions of consumer endpoints instantly, shifting the core paradigm from static television viewing to responsive, location-aware digital interactions.
Explore More Things To Do
Eurovision Grand Final Live Broadcast Schedules and UK Start Time in London
Green Belt Protection And Neighborhood Planning: Hadley Wood News
What Climatic Patterns Shape the Long-Term Seasonal Baseline Data for London?
London possesses a temperate maritime climate classified as Cfb under the Köppen climate classification system, regulated by the maritime influence of the North Atlantic Current. This positioning minimizes extreme thermal swings but creates consistent precipitation profiles throughout the annual cycle.
The long-term atmospheric baseline is defined by specific macro-scale configurations:
High-Pressure Systems
Anticyclonic blocks, such as the Azores High, bring extended periods of atmospheric subsidence. In summer, this leads to cloudless skies and elevated surface air temperatures; in winter, it results in radiation fog and surface frost layers.
Low-Pressure Systems
Cyclonic depressions originating over the North Atlantic travel along the polar jet stream, bringing organized frontal bands. These systems cause prolonged cloud cover, persistent rainfall, and elevated wind velocities across southeastern England.
Air Masses
The local weather depends on the dominant air mass trajectory. The five primary configurations impacting the capital include:
- Polar Maritime: Brings cool, showery conditions from the northwest.
- Tropical Maritime: Brings warm, high-humidity air from the southwest.
- Arctic Maritime: Drives sharp temperature drops from the north.
- Continental Polar: Generates cold, dry winter air flows from eastern Europe.
- Continental Tropical: Carries hot, dry air plumes northward from North Africa during summer.
(Data synthesized from historical 30-year regional baselines calculated by the UK Met Office (Essien et al., 2023)).
The long-term data indicates that while precipitation frequency remains uniform across all seasons—averaging between 11 and 15 wet days per month—the convective storms of late summer often yield higher absolute rainfall volume per hour than the prolonged, low-intensity stratiform rain common during the winter months.
How Does Climate Change Shift the Frequency of Extreme Events in the Capital?
Anthropogenic global warming alters the underlying thermodynamic properties of the regional atmosphere, changing baseline trends into highly volatile distributions. These systemic shifts directly impact municipal infrastructure planning and emergency management.
The primary physical mechanism driving intense precipitation changes is the Clausius-Clapeyron relation. For every 1 degree Celsius of atmospheric warming, the air’s water vapor holding capacity expands by approximately 7%. This expansion amplifies the precipitable water available to convective and frontal storms, leading to severe localized cloudbursts that overwhelm historical urban drainage networks. Concurrently, broader changes in the polar jet stream increase the persistence of stationary high-pressure blocks, trapping hot air masses over southeastern England and generating longer, more intense heatwaves.
The real-world impacts show clear structural stress across London’s primary infrastructure networks:
- Thermal Fatigue on Transport: Surface track temperatures on unshaded sections of the London Underground and Network Rail networks can exceed 50 degrees Celsius during heatwaves, causing steel rails to expand and buckle.
- Flash Flooding: Intense summer cloudbursts exceed the volumetric capacity of subterranean Victorian brick sewer systems, causing urban flash floods that disable low-lying subterranean transport stations and subterranean electrical infrastructure.
- Urban Heat Mortality: The combination of sustained nocturnal heat retention inside high-density residential developments and limited domestic air conditioning amplifies heat stress, increasing excess mortality among vulnerable demographics.
These systemic alterations require updating historical weather baselines inside architectural design models, forcing a shift from historical observation to forward-looking predictive climate simulations (Faranda, 2025).
How Do Consumer Platforms Automatically Personalize and Present the London Forecast?
The modern digital interface leverages automated data processing pipelines to translate complex fluid dynamics calculations into intuitive, location-specific user interfaces. This automated workflow operates continuously without manual human intervention.
The delivery mechanism is structured around strict data processing phases:
- Geospatial Data Ingestion: The platform’s application programming interfaces ingest raw binary data from global forecasting grids every six hours, filtering for the exact latitude and longitude coordinates of Greater London.
- Downscaling and Spatial Interpolation: Statistical algorithms interpolate the coarse grid data down to specific points across the city, utilizing localized topographic maps to adjust parameters for elevation changes and proximity to the River Thames.
- Algorithmic Symbol Selection: A rule-based software logic layer evaluates the combined metrics of cloud cover fraction, precipitation probability, humidity, and wind velocity to choose specific vector icons. For example, if cloud cover fraction exceeds 80% and the precipitation index is below 20%, the system automatically displays the overcast symbol asset.
- Real-Time API Distribution: The finalized, structured datasets are packaged into light JSON files and distributed across globally cached networks, updating consumer smartphones, desktop web browsers, and smart wearables within milliseconds of model completion.
This structural design ensures that whether a user requests data for Croydon, Wembley, or the City of London, the system provides real-time, contextually accurate microclimatic data tailored to their precise geographic coordinates.
How does BBC Weather collect weather data for London?
BBC Weather receives meteorological data through commercial forecasting provider MeteoGroup, which combines information from the European Centre for Medium-Range Weather Forecasts and the UK Met Office. Data comes from weather stations, satellites, radar systems, and atmospheric balloons.